- The RV is much more sensitive to afterload changes than the LV
- because the RV has lower systolic elastance compared to the LV
- LV is a thicker, more muscular ventricle, ∴ the LV is able to handle ↑ afterload. This is not the case for the RV. For example, in acute PE the right heart can struggle.
- The RV depends on the LV for a substantial portion of its contractile function. This interaction is intensified in the context of RV failure.
- The main determinants of right ventricular function, like those of left ventricular function, are: 1
RV-PA Uncoupling
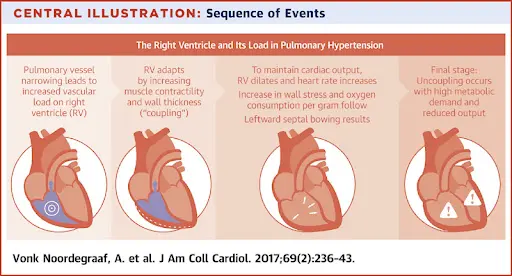
- In response to increased afterload (e.g., PAH, PE/CTEPH, PS) the RV will initially respond with RV hypertrophy 💪 (accompanied by an ↑ in contractility and preserved SV). Over time, as contractility declines or ↑ afterload, the RV must dilate to maintain SV. Eventually, oxygen demand exceeds supply and contractility further declines → a state of ventriculoarterial uncoupling and RV failure.1
- RV-PA uncoupling is when the RV can no longer adapt to increased PA afterload → Right Heart Failure.
- At first the RV compensates (couples) to increased PA pressure, but at some point the wheels fall off and the RV fails (uncoupling).
- Methods for assessment of RV-PA uncoupling:
- TAPSE/PASP ratio (tricuspid annular plane systolic excursion (TAPSE) by the PA systolic pressure (PASP))
- a ratio of RV-PA coupling to get a sense of the “efficiency” of RV stroke work on the PA
- lower values are associated with worse outcomes in different patient populations (e.g. HFpEF, Amyloidosis)
- TAPSE/PASP ratio (tricuspid annular plane systolic excursion (TAPSE) by the PA systolic pressure (PASP))
Echo
Assessment of RV Size
⚠️ Remember that (as with the LV) make your measurements at the compacted/non-compacted interface.
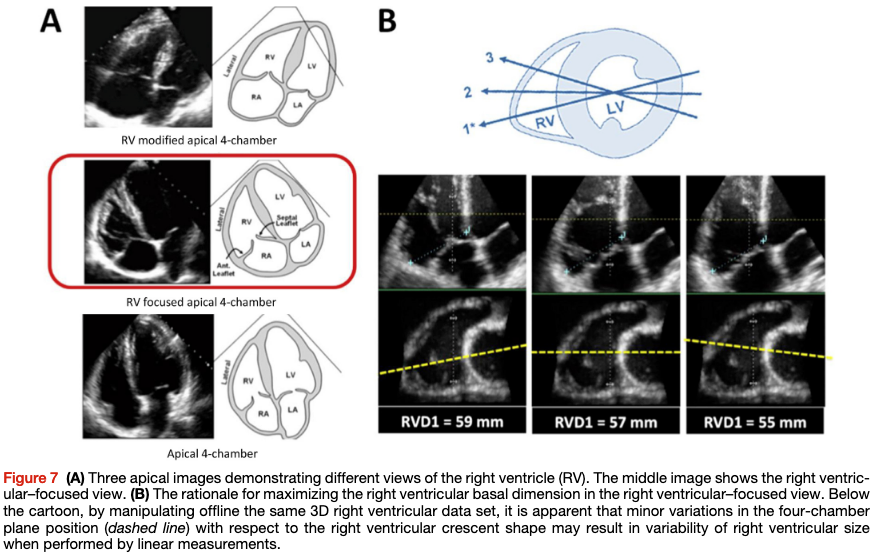
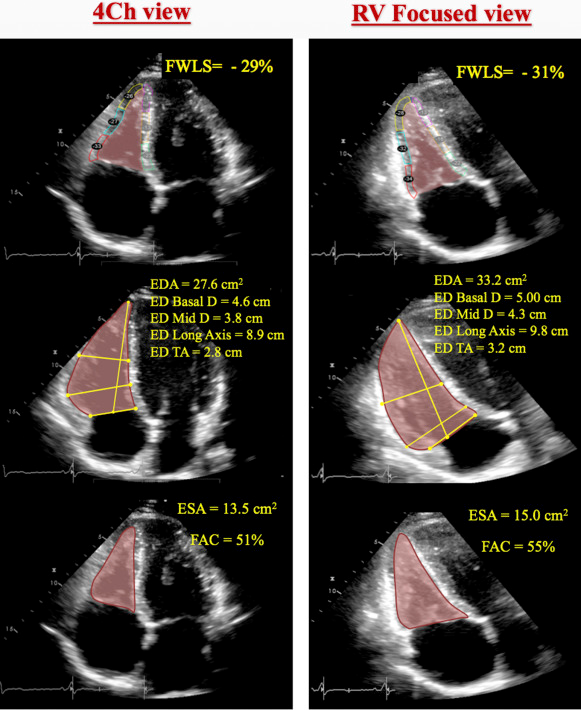
The conventional apical four-chamber view (i.e., focused on the left ventricle) results in considerable variability in how the right heart is sectioned, and consequently, RV linear dimensions and areas may vary widely in the same patient with relatively minor rotations in transducer position (Figure 7B). RV dimensions are best estimated from a RV-focused apical four-chamber view obtained with either lateral or medial transducer orientation (Figure 7A and Table 7). Care should be taken to obtain the image with the LV apex at the center of the scanning sector, while displaying the largest basal RV diameter and thus avoiding foreshortening. Of note, the accuracy of RV measurements may be limited when the RV free wall is not well defined because of the dimension of the ventricle itself or its position behind the sternum. Recent data have suggested that indexing RV “size” to BSA may be relevant in some circumstances, but the measurements used in those studies lacked the reference points of the RV-focused view and frequently used RV areas, rather than linear dimensions. 2
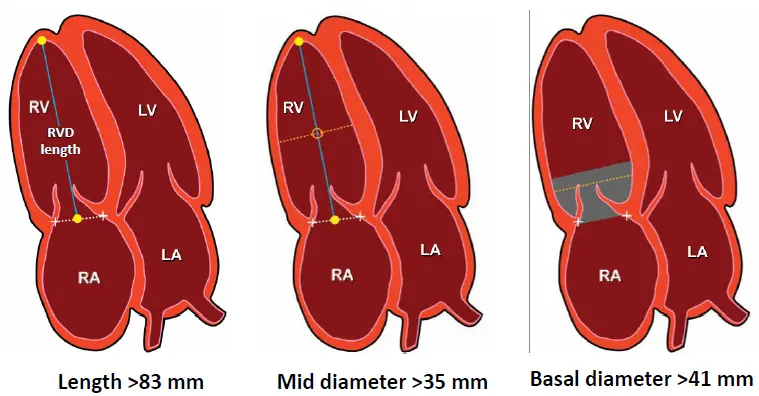
Rules of Thumb for RV Dilatation
In general, a diameter >41 mm at the base (widest part of the basal 1/3rd of the RV; do NOT measure at the annulus) and >35 mm at the midlevel in the RV-focused view indicates RV dilatation. 2
- In the standard Apical 4-Chamber (A4C) view, you are just eyeballing to compare the RV size against the LV size.
- 📝 if the LV is enlarged and the RV looks “normal,” it is not actually normal, rather it may also be enlarged.
- The standard A4C view is NOT the view you want to measure your RV in.
- RV modified A4C View: pull R heart into view and remove the LV from the picture → RV apex is at the top of the view.
- 🌟RV focused A4C View: LV apex is at the top of the view, but angulated transducer to tip the RV into better view. This view allows you to measure the maximal RV diameter.
- This is the view that you will want to use to take measurements for RV size
See the following image from 3 that helps illustrate the importance of getting the optimal view for RV size assessment:
RV Size Reference Values
Reference values for RV dimensions are listed in Table 8. 2
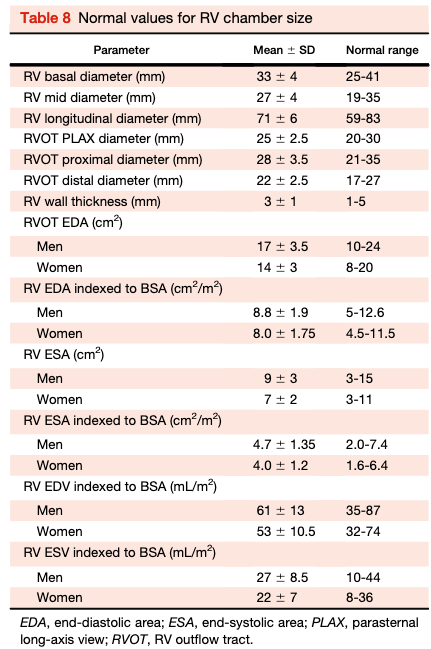
 Table source: 4
Assessment of RV Function
Table 10 Normal values for parameters of RV function
| Parameter | Mean ± SD | Abnormality threshold |
|---|---|---|
| TAPSE (mm) | 24 ± 3.5 | <17 |
| Pulsed Doppler S wave (cm/sec) | 14.1 ± 2.3 | <9.5 |
| Color Doppler S wave (cm/sec) | 9.7 ± 1.85 | <6.0 |
| RV fractional area change (%) | 49 ± 7 | <35 |
| RV free wall 2D strain* (%) | - 29 ± 4.5 | > - 20 (<20 in magnitude with the negative sign) |
| RV 3D EF (%) | 58 ± 6.5 | <45 |
| Pulsed Doppler MPI | 0.26 ± 0.085 | >0.43 |
| Tissue Doppler MPI | 0.38 ± 0.08 | >0.54 |
| E wave deceleration time (msec) | 180 ± 31 | <119 or >242 |
| E/A | 1.4 ± 0.3 | <0.8 or >2.0 |
| e’/a’ | 1.18 ± 0.33 | <0.52 |
| e’ | 14.0 ± 3.1 | <7.8 |
| E/e’ | 4.0 ± 1.0 | >6.0 |
| MPI , Myocardial performance index. |
TAPSE
See Tricuspid Annular Plane Systolic Excursion (TAPSE)
Fractional Area Change (Poor Man’s EF)
- Obtain in RV focused A4C view
- Values < 35% are consistent with RV dysfunction
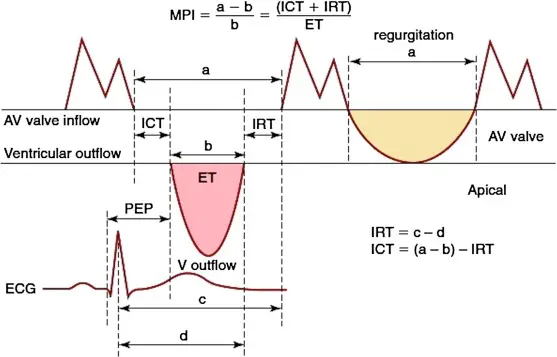
RV Index of Myocardial Perfusion (RIMP)
Probably should NOT use to assess RV systolic/diastolic function (at least not in isolation)
- aka Tei Index
- Global indicator of systolic and diastolic dysfunction
- Based on Doppler timing:
- tricuspid regurgitant tracing (interval denoted by in the figure below)
- RVOT ejection time ()
- 📝 Looks at isovolemic contraction (IVCT) and relaxation (IVRT) times
- Relatively independent of HR or afterload
- Modestly prognostic in Pulmonary Hypertension, right-heart disease
- Why you probably shouldn’t use it?
- Underestimates severity of disease
- Do NOT use in isolation
- Not recommended to follow patients with right-heart disease
RV Systolic Strain
Longitudinal strain is calculated as the percentage of systolic shortening of the RV free wall from base to apex, while longitudinal strain rate is the rate of this shortening. 2
- Abnormal if values are less negative than -25% (or lower than 25% in absolute value)
- 📝 Mayo Board Review uses 25% number, whereas 2 uses 20%.
- Importantly, the cutoff value is a higher number than that used for strain with LV
- Should be measured in the RV-focused A4C view
- Speckle tracking longitudinal strain
- Angle independent
- Not prone to translational motion
- Most studies focus on the free wall
McConnell’s Sign
See McConnell’s Sign
RV After Cardiac Surgery
With any cardiac surgery, you typically see an acute reduction in RV longitudinal contractility. But there is a compensatory increase in radial function. ∴ post-op, you will expect to find TAPSE or S’ are low but FAC or EF are preserved. This tends to resolve overtime.
- Lesson: in post-cardiac surgery patients, don’t call RV dysfunction based on TAPSE or S’ alone.
Footnotes
-
Houston BA, Brittain EL, Tedford RJ. Right Ventricular Failure. N Engl J Med. 2023 Mar 23;388(12):1111-1125. doi: 10.1056/NEJMra2207410. PMID: 36947468. ↩ ↩2
-
https://asecho.org/wp-content/uploads/2015/01/ChamberQuantification2015.pdf ↩ ↩2 ↩3 ↩4 ↩5
-
Genovese, D., Mor-Avi, V., Palermo, C., Muraru, D., Volpato, V., Kruse, E., Yamat, M., Aruta, P., Addetia, K., Badano, L. P., & Lang, R. M. (2019). Comparison Between Four-Chamber and Right Ventricular–Focused Views for the Quantitative Evaluation of Right Ventricular Size and Function. Journal of the American Society of Echocardiography, 32(4), 484–494. https://doi.org/10.1016/j.echo.2018.11.014 ↩
-
Mukherjee M, Rudski LG, Addetia K, Afilalo J, D’Alto M, Freed BH, Friend LB, Gargani L, Grapsa J, Hassoun PM, Hua L, Kim J, Mercurio V, Saggar R, Vonk-Noordegraaf A. Guidelines for the Echocardiographic Assessment of the Right Heart in Adults and Special Considerations in Pulmonary Hypertension: Recommendations from the American Society of Echocardiography. J Am Soc Echocardiogr. 2025 Mar;38(3):141-186. doi: 10.1016/j.echo.2025.01.006. Erratum in: J Am Soc Echocardiogr. 2025 Jul;38(7):641. doi: 10.1016/j.echo.2025.05.001. PMID: 40044341. ↩