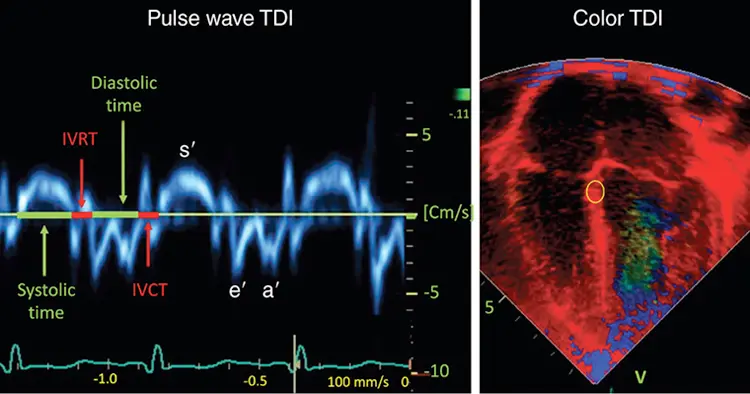
The normal mitral annular tissue velocity pattern contains 3 dominant waves:
s′ wave: systole
e′ wave: represents relaxation in early diastole
a′ wave: caused by atrial contraction in late diastole.
Also seen are sets of biphasic waves during isovolumic contraction (IVCT) and relaxation (IVRT).
Because the annulus ends up in the same place on each beat, the area under the s′ wave (distance the annulus descends toward the apex) must roughly equal the sum of the areas under the e′ and a′ waves.
Mitral annular e’ velocity
⚠️ Tissue Doppler e′ reflects relaxation of the long axis of the LV, and can be unreliable in the setting of incorrect sample volume placement, poor visualization of a dilated MV annulus, mitral annular calcification, severe mitral regurgitation, tachycardia, atrial fibrillation, constrictive physiology, ventricular dyssynchrony, or focal wall motion abnormalities.
∴ Echocardiography only allows the reader to say there is an higher likelihood of increased filling pressures if lateral E/e′ >12 (or septal E/e′ > 15), there is no significant mitral annular calcification, and the aforementioned clinical scenarios are not present.
In patients with significantly elevated PASP (e.g., >50 mm Hg), an A ratio <1 is indicative of PAH because the LA is underfilled (due to pulmonary vascular disease obstructing blood flow through the lungs), and extrinsic compression of the LV by the RV, resulting in decreased LV compliance.
In these patients, lateral e′ velocity is typically normal, but septal e′ velocity is often reduced because the septal mitral annulus is also influenced by an abnormal RV in the setting of PAH. In patients with pulmonary venous hypertension, the lateral e′ velocity is typically reduced, lateral E/e′ is increased, and the E/A ratio should be >1