- Bateman dumbing it down for me
- LAD supplies 45-65% of the LV
- RCA supplies at most ~20% of the LV if a dominant RCA
- Preparation prior to MPI PET
- 6-hour fast except water
- 12-hour caffeine ☕ avoidance
- 48-hour theophylline avoidance
- The most common cause of non-response to Regadenoson is failing to avoid caffeine ☕
- Half-life of caffeine in a healthy, young person is 4.5 hours. One of the reasons Bateman suspects there are issues of non-response with Regadenoson in patients with liver disease is that the caffeine lingers around much longer.
- Wall volume on Cedars: anything ≥ 125 mL should make you think of LVH
- Sperry: “if I see the septum (with reduced counts), sometimes I wonder if this may be LBBB”
- Sperry on using motion freeze: if it makes the defect look better, he may accept it. However, if it makes the defect look worse, he may discount it.
Identifying the level - apex, mid, base
- Select the apex: Sperry identifies will scroll to identify the bottom at the apex is lined up in both the stress and rest images. He then places the box (🔲) two slices above this by clicking
Ctrland selecting these frames. - Select the base: identify the frame where you first lose the septal wall → shift a couple frames apically and place the box (🔲) over these frames
- ⚠️ important to recognize that the way we orient the heart in these images that top of the basal portion of the septal wall doesn’t exactly line up with that of the lateral wall. Don’t neglect perfusion defects in the basal lateral walls!
- Select the mid: find the frame in between your apical and base boxes (🔲) → place the box (🔲) over these frames
Dealing with “hotspots”
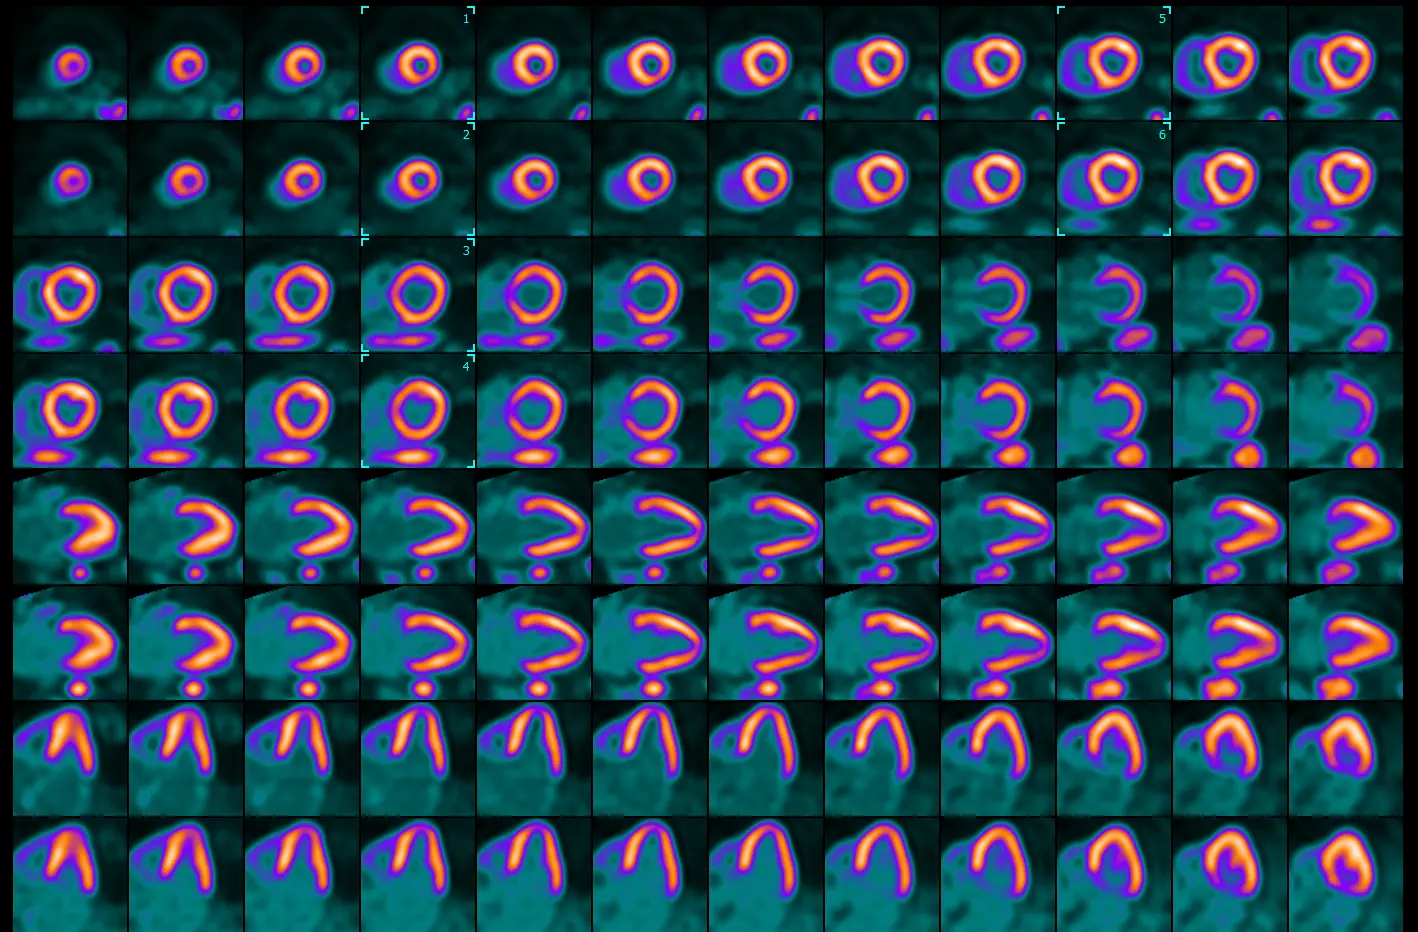
- Bateman shared with me a trick from a nuc reader at TJU to handle instances with “hotspotting.”
- Split → Use
Isocontour- For the stress images, ∆ the toggle until you begin to see white (⚪) in areas of the myocardium that are not the hotspot area.
- Then, for the rest images, ∆ the toggle to the same level to check for perfusion defects
Transient ischemic dilation (TID) ratio
- TID is the ratio of stress endocardial volume to rest volume.
- In other words, a TID of 1.1 indicates that the LV volume during stress is 10% larger than at rest.
- PET: Normal < 1.15, Abnormal ≥ 1.15
- SPECT: Normal < 1.3, Abnormal ≥ 1.3
Perfusion Defect Scores
- Perfusion defect scores
- Summed stress score (SSS)
- Summed rest score (SRS) - infarct
- Summed difference score (SDS) - ischemia
- Max cumulative score for SRS, SDS is 68 (i.e. 17 x 4)
- Each segment of the 17-segment model takes a value between 0 (normal tracer uptake) and 4 (absence of tracer uptake) to obtain SSS and SRS
Reporting Flows
- Post-CABG you divide circulation between native and graft circulation. In the native circulation, physiology rapidly deteriorates (→ low flow). So we will typically see greater amounts of calcification in native circulation and low flow. This is not a reflection of graft closure, rather it is progression of native disease post-CABG.
- ⚠️ Be careful about reporting flows post-CABG so that referring doctor is not concerned about low flows and inadvertently sending patient to cath lab. If normal, Bateman will report them. If not normal (especially globally), it is probably best to not report them.
- ‘Not reported because not clinically relevant.’
- ⚠️ Be careful about reporting flows post-CABG so that referring doctor is not concerned about low flows and inadvertently sending patient to cath lab. If normal, Bateman will report them. If not normal (especially globally), it is probably best to not report them.
- Other conditions where reporting flows may not be clinically relevant would be liver failure, renal failure.
- In patients with cirrhosis/ESLD, our protocol is to have them do Dobutamine (instead of vasodilators like regadenoson)
Snapshot
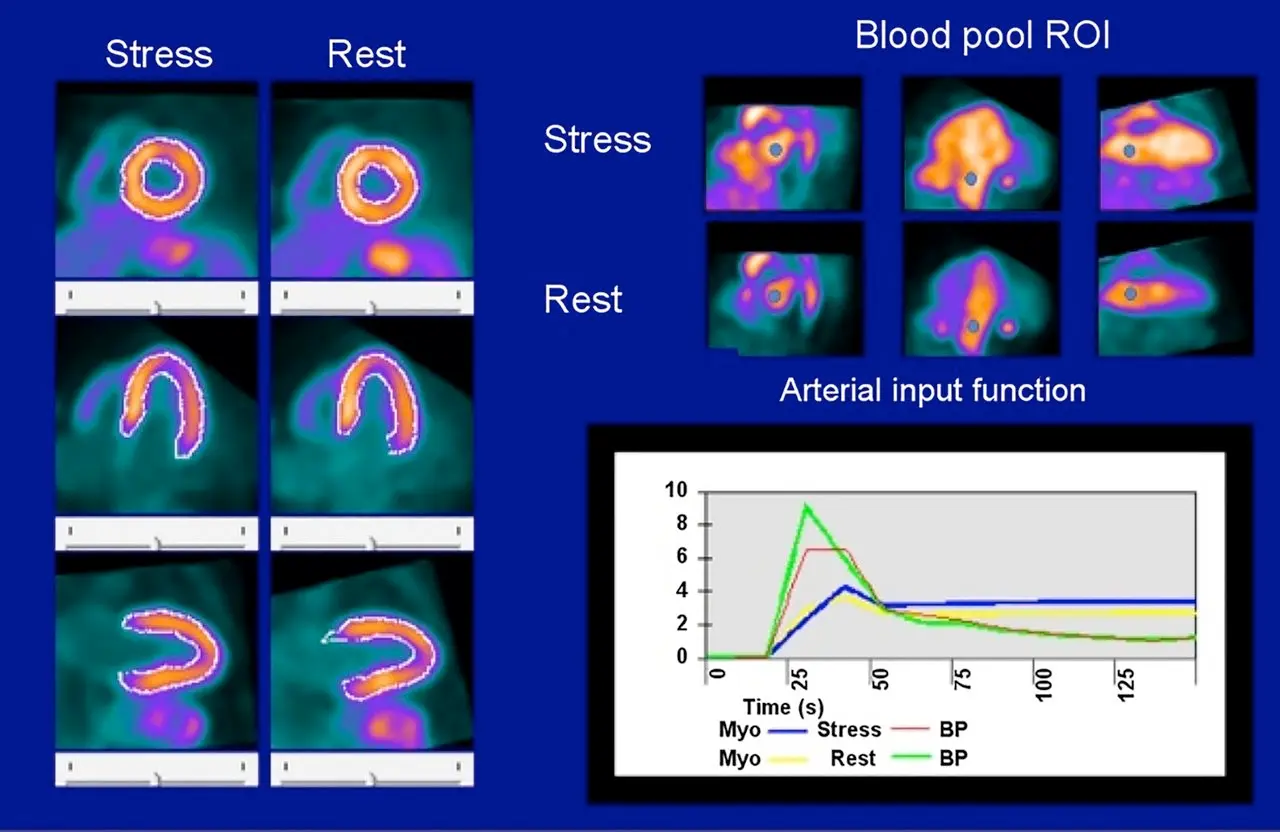
- Steps:
- At , tracer has has not entered the heart
- At the peak it has entered the heart
- At the plateau, it has now entered the myocardium
- Initially, counts higher in blood pool than myocardium → then flips
- So at the peak, the green curve will be highest
- In the plateau phase, the signal-to-noise reflects the counts in myocardium (blue) and blood pool (red)
- Resting flows can be documented as high if the graph starts at is above 0.
- Generally peak rest blood pool (green) is 30% higher than peak stress blood pool (red).
- If < 30%, then potentially problematic for flow calculation
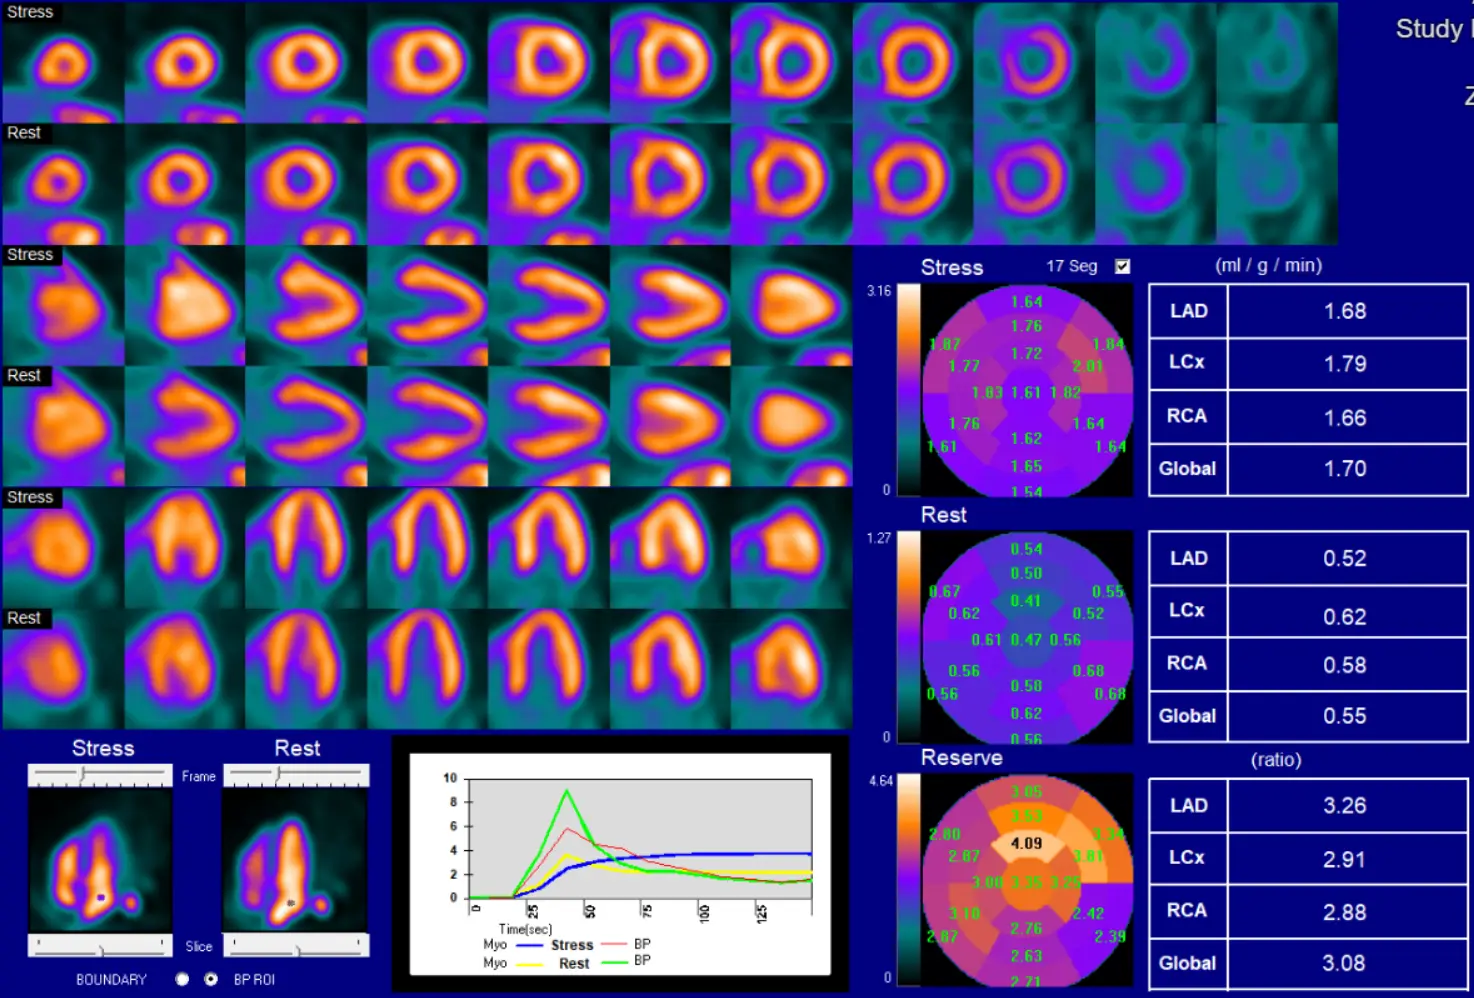
- You should expect a sharp rise and fall for the blood pool curves before the plateau phase. If it is wide, then there may be a technical issue.
- Compartment models are more sensitive if the QC is problematic.
Below is an example of impaired quality due to a technical issue, such as poor IV affecting infusion, long IV tubing, etc.
Quality Control
Slice
- On the left and right side of the screen, you can shift the cyan colored lines to intersect your short axis views to make sure you are looking at appropriate cuts to represent apical, mid- and basal views.
Misregistration
- Let’s say that the LV is not correctly drawn, you can manually adjust the registration:
- In the
Slicetab, select theManualbutton in the top row - Edit things to your liking
- Click
MaskandConstrain - Lastly, click the
Processbutton at the top row
- In the
QGS
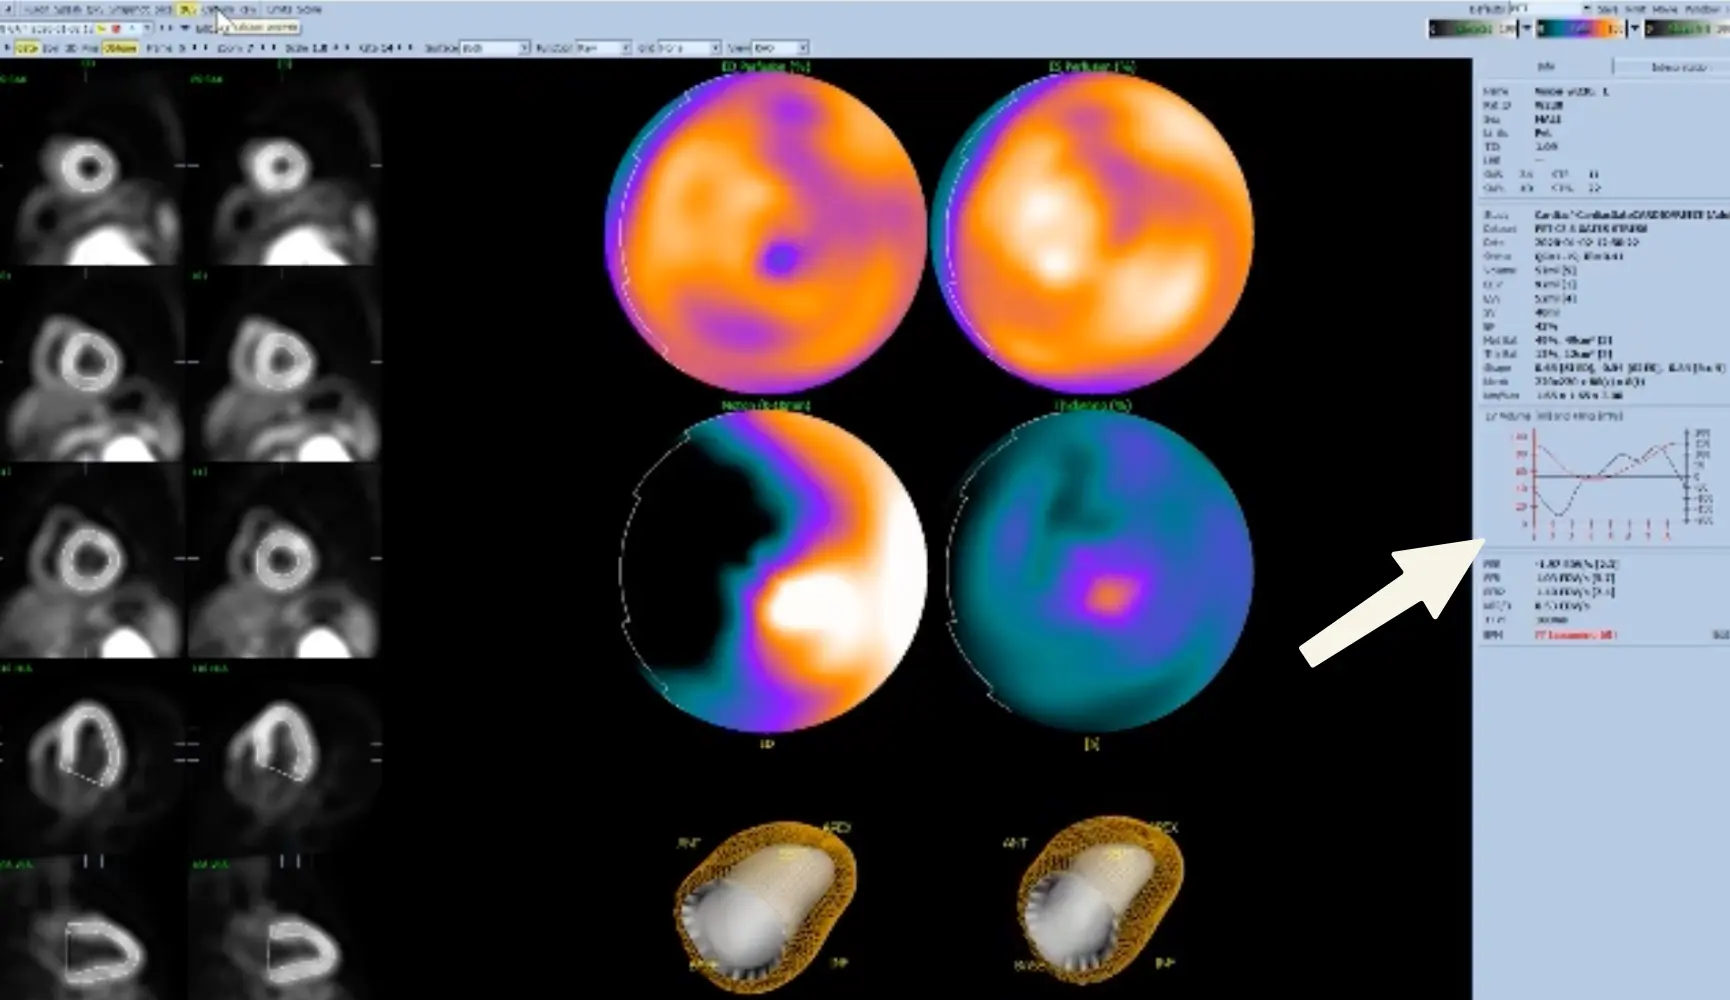
- Sanity check for EF estimation
- Look at the curve on the right
- The red line should be ‘V-shaped’ (makes sense as you go between diastole-systole-diastole).
- In reality, I’ve mostly seen it more U- than V-, but the point is that there should be a distinct trough/inflection point.
- As you can imagine, AFib can sometimes be finnicky.
- ⚠️ Data support that EF can be reported a little higher when using 16 vs 8 frames/second.
- Look at the curve on the right
Splenic Shut-off (SSO)
Splenic non-responders (no SSO)
1 found that splenic non-responders, i.e. absence of SSO, was associated with higher rates of abnormal MBFR (< 1.5), lower augmentation of HR or EF with stress. Thus, absence of SSO “may not necessarily indicate a patient’s non-response to the vasodilatory agent.” ∴ Look at the whole context!
- Look for splenic shutoff in the
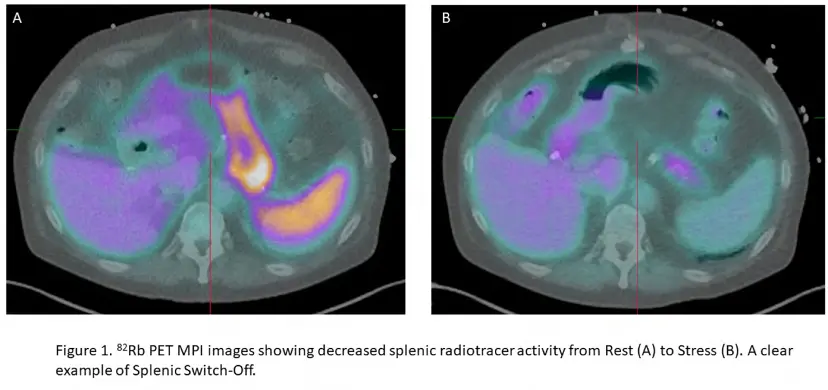
Fusiontab → pull up the Stress and Rest images - Splenic shut-off (SSO; aka splenic switch-off) is a marker of adequate vasodilator response to pharmacologic stress. Recall, failure to induce proper coronary hyperemia may result in false-negative studies.
- If SSO is present, i.e. bright on rest and not on stress, then it indicates sufficient cardiac vasodilation.
- SSO describes a decrease in splenic radiotracer activity from rest to stress. Lack of SSO based on visual or quantitative assessment can help identify inadequate vasodilatory response.
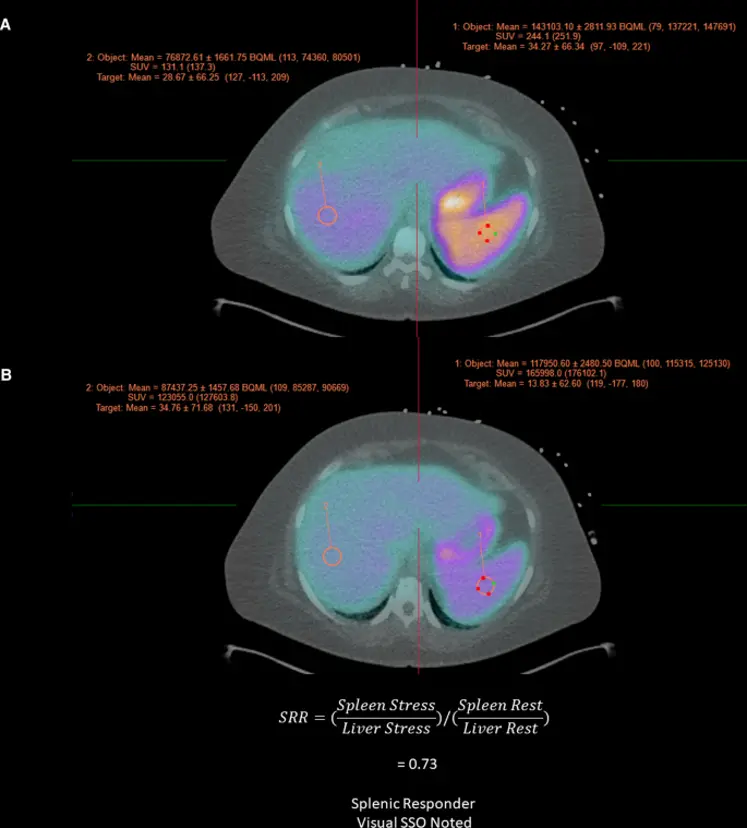 Figure source: https://pubmed.ncbi.nlm.nih.gov/36607537/
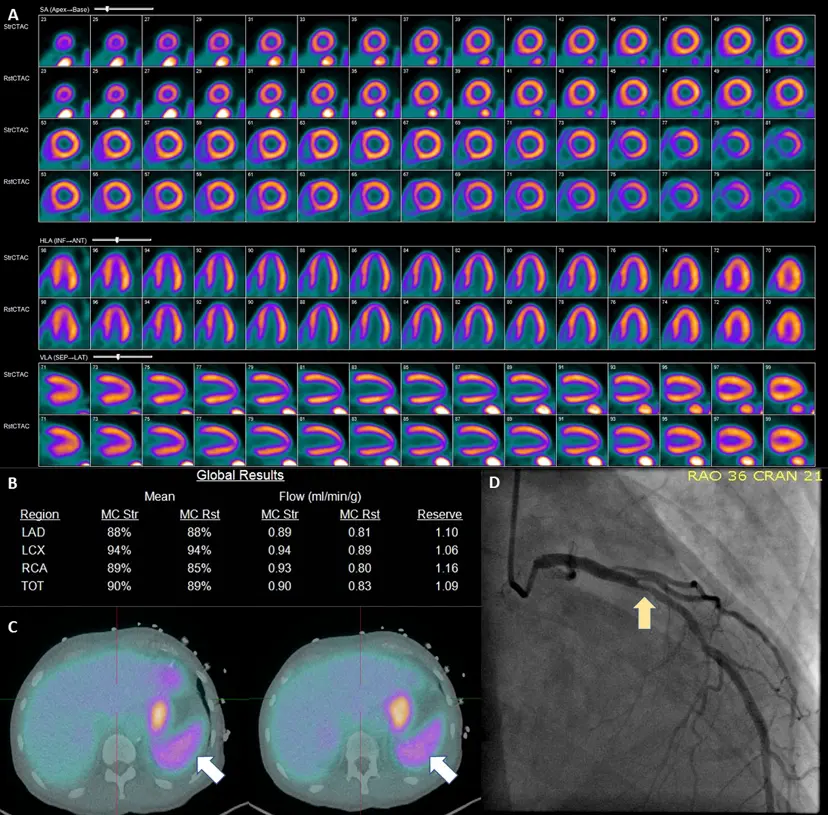
Example of Splenic Shutoff without Perfusion Defects
57-year-old male with hypertension, diabetes mellitus, and chronic kidney disease who presented for the evaluation for suspected CAD. A PET-MPI imaging revealed normal relative regional with no identifiable perfusion defects. (B) However, albeit a normal resting myocardial blood flows, the patient’s stress myocardial blood flow remained unchanged following the administration of regadenoson with a severely reduced myocardial flow reserve of 1.09. Assessing the patient’s hemodynamic responses, we can also note an unchanged heart rate (75 bpm rest vs 76 bpm stress) and failure to observe expected EF enhancement (36% at rest vs 37% at stress). The patient’s coronary artery calcium score (6246) only served to increase the concern for CAD. (C) Inspection of the spleen (white arrows) reveals a failure to exhibit visual signs of splenic switch-off (SRR was 1.1). Based on these findings, the patient was recommended to obtain an invasive catheterization due to growing suspicion of non-response to regadenoson. D ICA revealed a significant obstructive coronary artery disease LAD (Left Anterior Descending) lesion (yellow arrow) 1
SPECT
- In Cedars, scans that end with
_ACare attenuation corrected and scans that end with_SCare scatter corrected. - In the
QPStab, selectingProne+will overlay the supine and upright images- 🤔 Does the defect go away when the images are overlaid?
QC for SPECT
- Click the
Rawtab at the top- Appreciate the appearance of the heart
- You may also notice pleural/pericardial effusion and uptake elsewhere, e.g. infection/pneumonia, tumor, etc.
- Perfusion pattern
- Artifacts
- Bouncing heart
- Lateral wall motion/Lateral wall hot spot
- Diaphragmatic attenuation
- Breast attenuation
- Upward creep - may be seen if a patient hops onto the scanner shortly after exercise. Due to the diaphragm going up and down as the patient is huffing and puffing following exercise.
- This is why some protocols will have patient wait ~15 mins post-exercise
- Appreciate the appearance of the heart
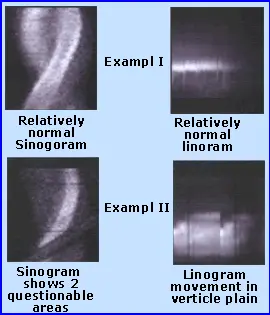
- Inspect the sinogram, linogram
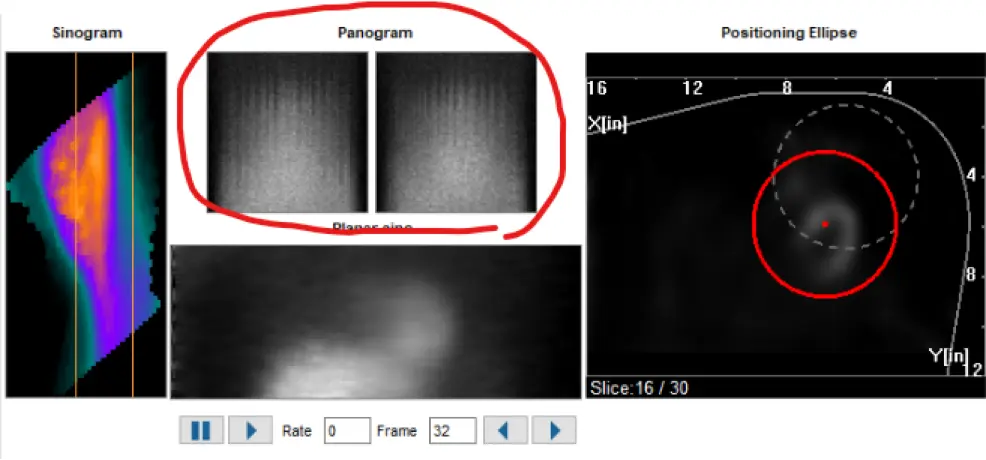
- “Hurricane sign” is suggestive of motion artifact on SPECT
- Motion artifact on SPECT can be seen as vertical lines on the Panogram
CT scans
- Look at the scout film (
TomogramorScout) - If IDA, then HU can be <25-30 HU
- Mitral Annular Calcification (MAC)
- Look for anomalous coronaries
- Look for enlargement of heart structures, e.g. atrium, ventricles, coronary sinus
- Can also try to get a sense of dominance, e.g. large LCx feeding or RCA
- Switching to MIP (instead of MPR) will allow you to see lung nodules better
- Reporting
- If lung nodule is < 6 mm, then probably don’t need to report (unless there are a bunch, etc.)
- If nodule(s), then “Recommend standard acquisition full lung CT”
- Lymphadenopathy
- Hernias: hiatal, Morgagni, Bochdalek, etc.
- Dilation, e.g. atrial, aortic root, etc.
- Lipomatous hypertrophy of interatrial septum
